ZoomCharts Review - why 5 stars?
Compare Pricing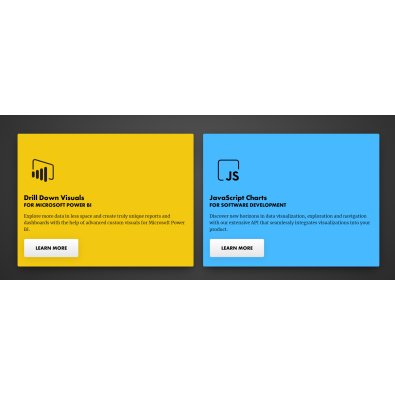
| ITQlick Score: | 82/100 |
|---|---|
| ITQlick Rating: |
|
| Pricing: | 4/10 - average cost |
| Category: | Data visualization -> ZoomCharts review |
| Ranking: | Ranked 5 out of 20 Data visualization systems |
| Company: | Data Visualization Software Lab |
| Pricing: | starts at $0.99 per user/month |
| Typical customers: | Small, medium and large size businesses |
| Platforms: | Mobile, Cloud |
| Links: | ZoomCharts pricing, ZoomCharts alternatives |
 Shlomi Lavi / updated: Apr 30, 2023
We publish unbiased reviews. Our opinions are our own and are not influenced by payments from advertisers. This content is reader-supported, which means if you leave your details with us we may earn a commission. Learn why ITQlick is free .
Table of Contents
What is ZoomCharts?
ZoomCharts is a dynamic data visualization software that allows users to create stunning visualizations of complex data sets. Established in 2013 in Riga, Latvia, the company has quickly gained a reputation as a leading provider of data visualization solutions.
The software is designed for businesses, researchers, and data scientists seeking to unlock the insights hidden within their data. With an intuitive and user-friendly interface, even those with limited experience in data visualization can create beautiful and informative graphs and charts.
One of the key features of ZoomCharts is its ability to handle large data sets. Whether you are dealing with millions of data points or thousands of rows of data, the software can quickly and easily create visualizations that are both comprehensive and accurate.
Another important feature of ZoomCharts is its flexibility. With a wide range of visualization types, including bar charts, line charts, pie charts, and more, users can create visualizations that are tailored to their specific needs. In addition, the software includes advanced visualization types, such as heat maps and network graphs, allowing users to uncover insights that might be missed with more basic charts and graphs.
ZoomCharts also includes powerful collaboration features, making it easy for teams to work together on data visualization projects. With the ability to share visualizations with others and collaborate in real-time, users can work together to make sense of complex data sets.
In addition to its powerful features, ZoomCharts is also committed to providing exceptional customer service and support. With a team of experienced developers and data scientists, the company is available to help users at every step of the process, from importing data to creating complex visualizations.
Overall, ZoomCharts is a powerful and flexible data visualization solution that is ideal for businesses, researchers, and data scientists seeking to unlock the insights hidden within their data. With its intuitive interface, powerful features, and commitment to customer service, ZoomCharts is a leading provider of data visualization solutions that is sure to help you make sense of your data.
Who is it best for?
ZoomCharts serves a wide range of customers in various industries, including finance, healthcare, government, retail, and education. These industries often have complex data sets that require powerful data visualization tools to make sense of the data and uncover insights.
Here are five examples of companies that use ZoomCharts:
-
IBM - As a global technology company, IBM uses ZoomCharts to create interactive dashboards and visualizations to help its clients make sense of complex data sets.
-
Johnson & Johnson - The multinational medical devices, pharmaceutical, and consumer goods company uses ZoomCharts to create visualizations that help to identify patterns and trends in healthcare data.
-
ExxonMobil - The global oil and gas company uses ZoomCharts to create interactive visualizations that allow employees to better understand data related to drilling, exploration, and production.
-
Airbnb - The popular vacation rental platform uses ZoomCharts to create data visualizations that help to track and analyze key metrics related to bookings, revenue, and user behavior.
-
University of California, Los Angeles (UCLA) - As a leading research university, UCLA uses ZoomCharts to create visualizations that help researchers to better understand complex data sets related to healthcare, economics, and social sciences.
Overall, ZoomCharts serves a diverse range of customers in various industries, helping them to unlock the insights hidden within their data and make better decisions based on their findings.
Main features and functionalities
ZoomCharts can help your business in a number of ways by providing powerful data visualization solutions that can help you unlock insights from your data. Here are a few ways that ZoomCharts can help your business:
-
Better understand your data - With ZoomCharts, you can create visualizations that help you see patterns, trends, and relationships in your data that might not be visible with traditional spreadsheets or databases. This can help you make more informed decisions based on your data.
-
Communicate insights to stakeholders - ZoomCharts interactive visualizations can help you communicate insights from your data to stakeholders more effectively. By presenting data in a more engaging and visually appealing way, you can help stakeholders better understand the significance of your findings.
-
Streamline data analysis - ZoomCharts powerful data visualization tools can help you streamline your data analysis processes, allowing you to analyze data more quickly and efficiently.
-
Collaborate on data analysis - ZoomCharts collaboration features make it easy for teams to work together on data analysis projects, allowing multiple stakeholders to contribute to the analysis and interpretation of data.
-
Identify new opportunities - By uncovering insights from your data, ZoomCharts can help you identify new opportunities for growth and optimization within your business.
Overall, ZoomCharts can help your business make better decisions by providing powerful data visualization solutions that help you see patterns and relationships in your data that might not be visible with traditional data analysis tools.
What is the actual cost?
ZoomCharts pricing and plans are One Visual Plan at $0.99 per user/month and All Visuals Plan at $2.99 per user/month. For their Enterprise Edition, you can contact the company to request a quote.ITQlick pricing score is 4 out of 10 (10 is most expensive). Access ITQlick pricing guide for ZoomCharts. You can also find here pricing information from ZoomCharts's website.
Pros
- ZoomCharts offers highly interactive and engaging data visualizations, such as drill-downs, filtering, and cross-chart highlighting. This sets it apart from competitors that offer more static visualizations.
- ZoomCharts can connect to a wide range of data sources, including real-time data, big data, and cloud-based data sources. This makes it more versatile and scalable than competitors that may have limitations in terms of data source compatibility.
- ZoomCharts allows users to fully customize their visualizations, from data formatting to chart types and styles. This flexibility allows users to create visualizations that are tailored to their specific needs and preferences, setting it apart from competitors that may have more rigid formatting and customization options.
Cons
- ZoomCharts can have a steep learning curve, especially for users who are not familiar with complex data visualization tools. This can be a disadvantage compared to competitors that offer more intuitive and user-friendly interfaces.
- ZoomCharts has limited integrations with other software tools compared to some of its competitors, which can limit its compatibility and flexibility in certain environments.
- While ZoomCharts offers a variety of chart types, it may not have as many options compared to some of its competitors. This can be a disadvantage for users who need specific chart types or visualization techniques.
How it stacks up?
Access a head to head analysis of ZoomCharts vs alternative software solutions.Frequently Asked Questions (FAQs)
List of categories
List of features
Auditor - Shlomi Lavi
Shlomi Lavi is an entrepreneur and founder of ITQlick.com. He holds a Bachelor of Science (B.Sc.) in Information Systems Engineering from Ben Gurion University in Israel. Shlomi brings 17 years of global IT and IS management experience as a consultant and implementation expert for small, medium and large-sized (global) companies. Shlomi’s goal is to share the best knowledge and news about information systems so you can make smarter buying decisions for your business.